
Windows XP のクラッシュダンプを解析する(Windows SDK for Windows 7)
2013/08/10
文書番号:20298
Windows のクラッシュダンプを解析する(Windows SDK for Windows 8) ではWindows SDK for Windows 8 をインストールしてWindows 7 のクラッシュダンプを解析しました。
次にWindows XP のクラッシュダンプを解析しようと思いましたが Windows SDK for Windows 8 の対象になっていないので、Windows SDK for Windows 7 をインストールして解析することにしました。
※下記手順はWindows XP 環境で実施しています。
- Windows 用デバッグツールをダウンロードします。
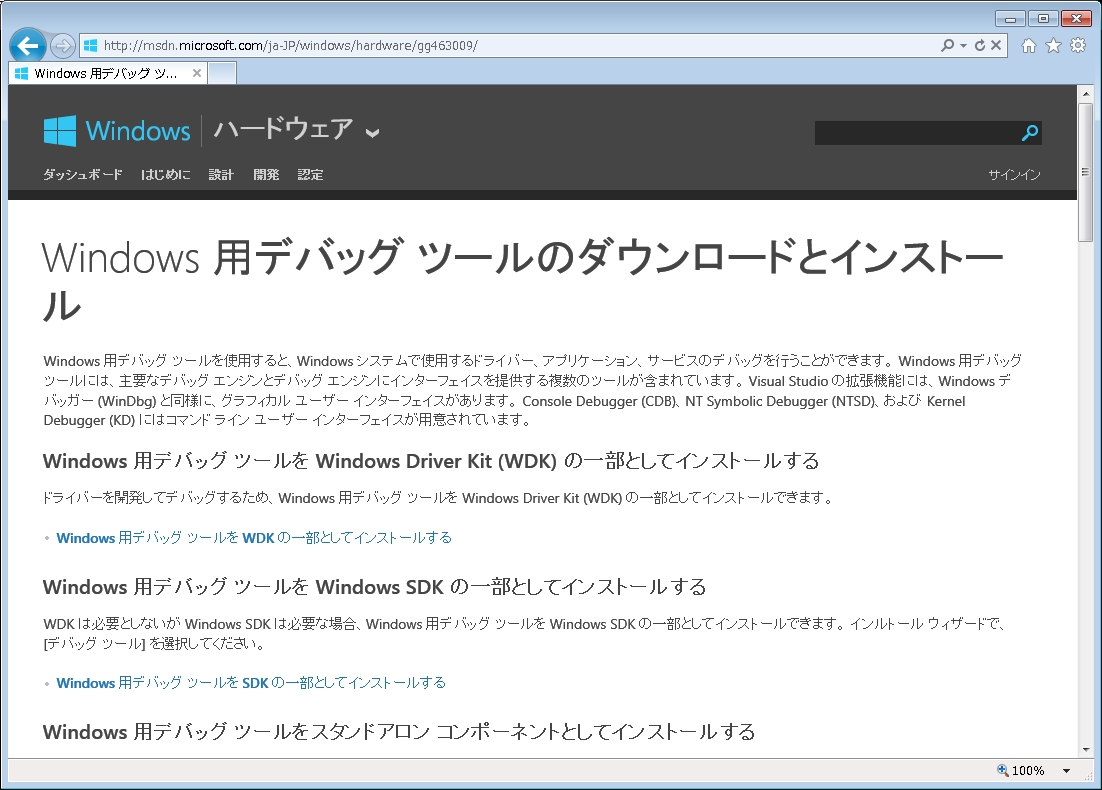
Windows 用デバッグ ツールのダウンロードとインストール
http://msdn.microsoft.com/ja-JP/windows/hardware/gg463009/
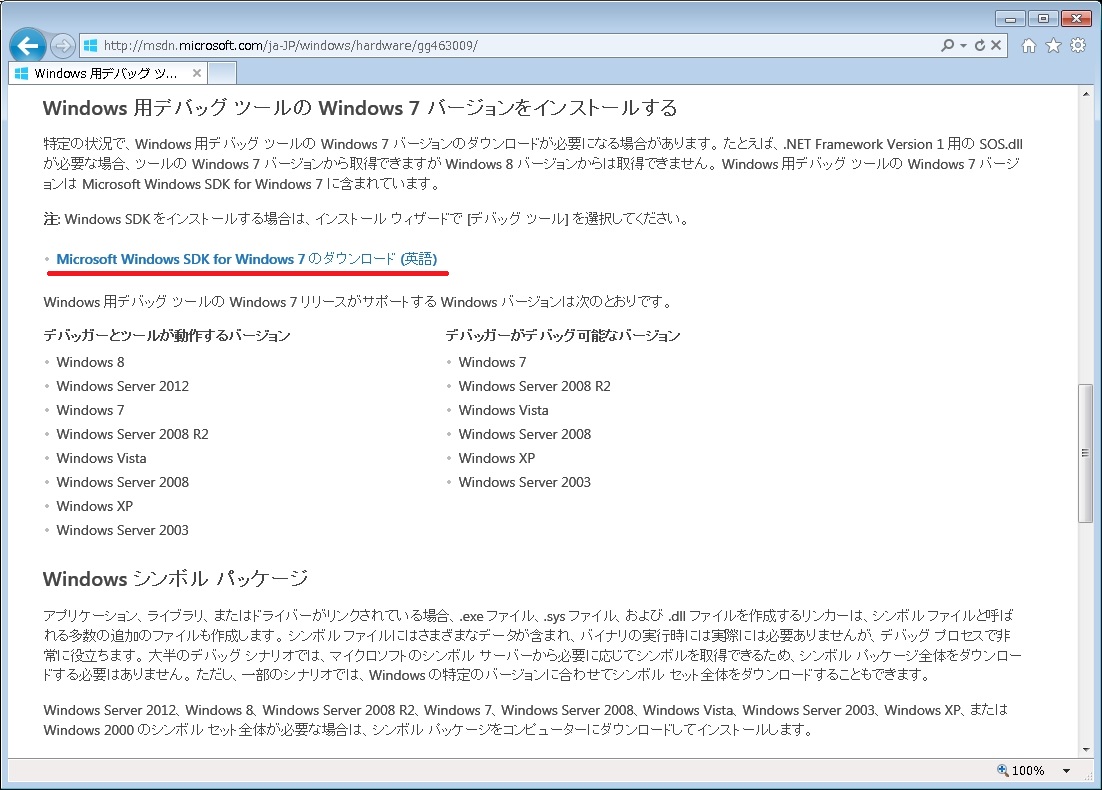
ページ内を中ほどまでスクロールし、「Microsoft Windows SDK for Windows 7 のダウンロード(英語)」をクリックします。
クリックで拡大
クリックで拡大
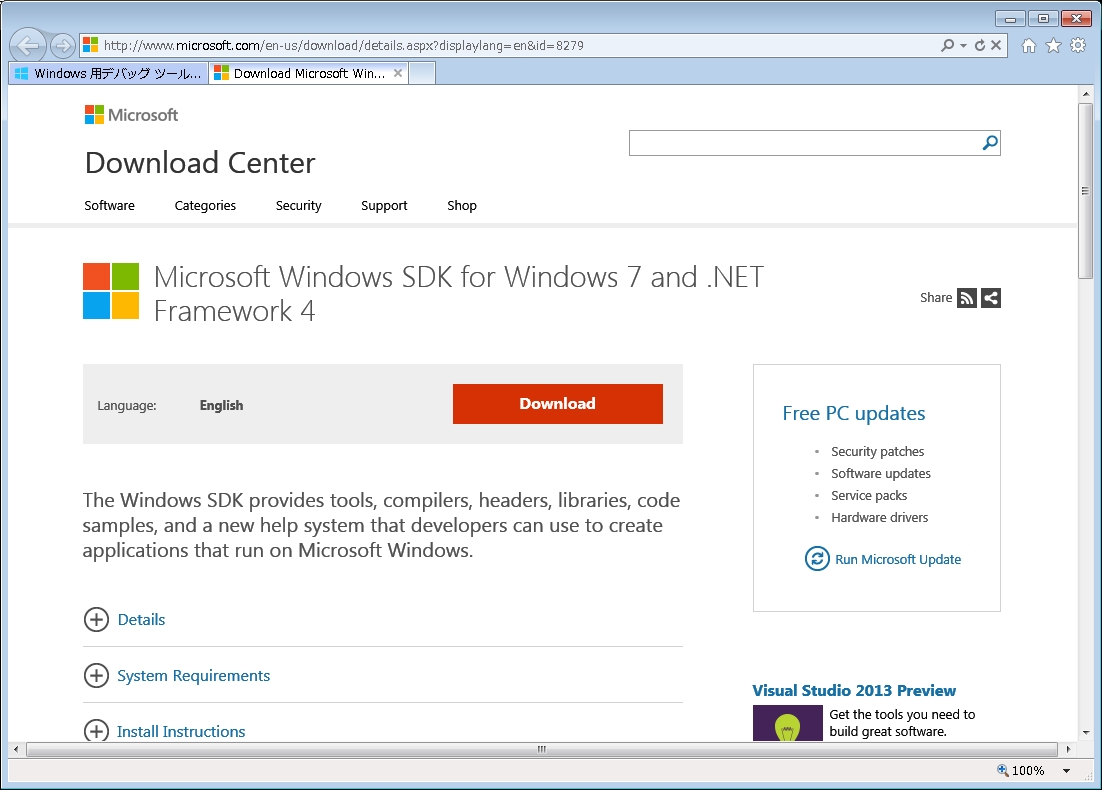
- 「Microsoft Windows SDK for Windows 7 and .NET Framework 4」のページに移動します。
「Download」ボタンをクリックしてダウンロードします。
クリックで拡大 - ダウンロードの確認ダイアログが表示されるので「実行」をクリックします。

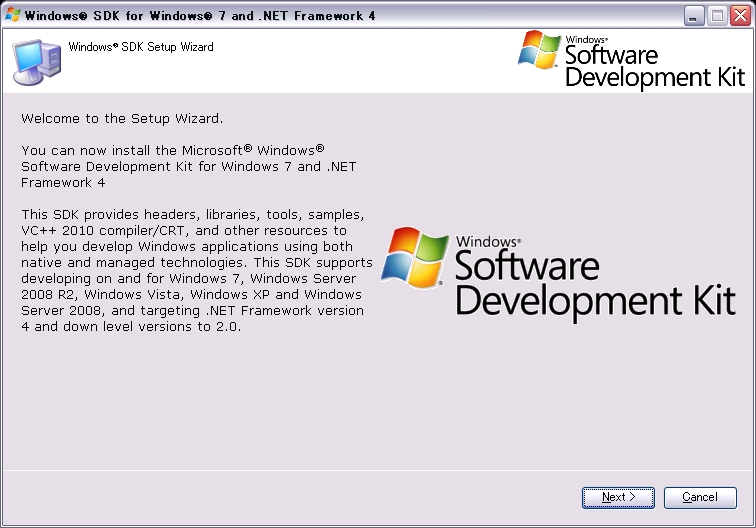
クリックで拡大 - インストールウィザードが起動します。
「Next」をクリックします。
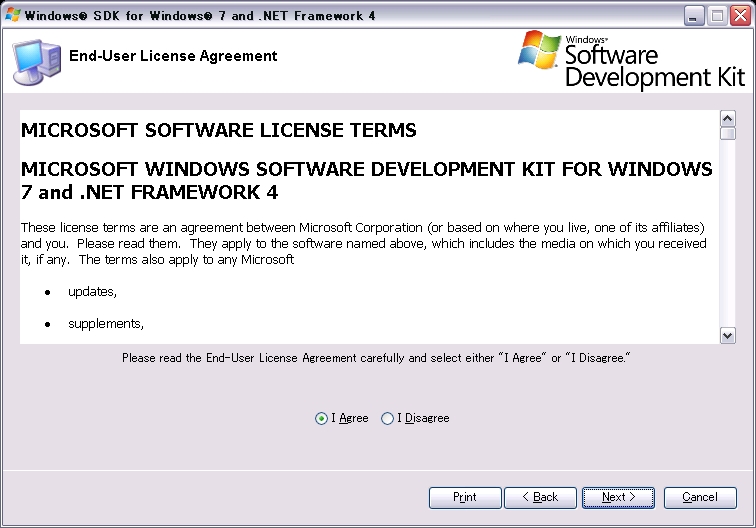
クリックで拡大 - 【End-User License Agreement】
ライセンス条項を確認し、「I Agree」にチェックを入れて「Next」をクリックします。
クリックで拡大
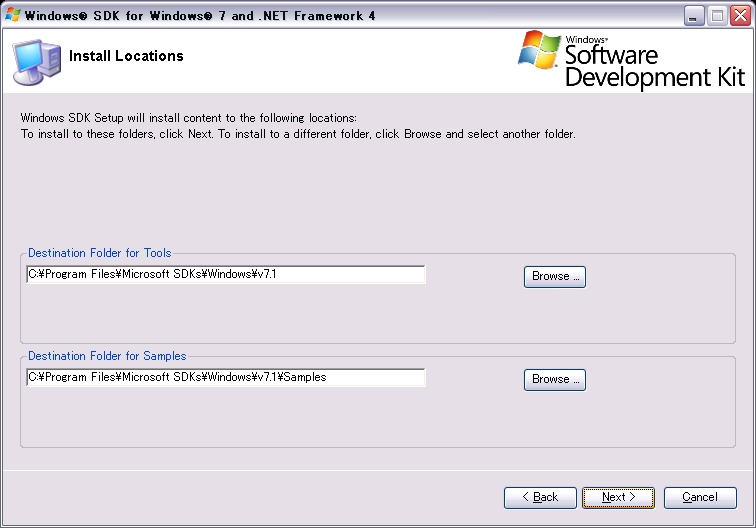
- 【Install Locations】
インストール先パスを選択して「Next」をクリックします。
クリックで拡大 - 【Install Options】
インストールオプションを選択して、「Next」をクリックします。

クリックで拡大 - 【Begin Installation】
「Next」をクリックするとインストールが開始されます。
クリックで拡大 - 【Installation Progress】
インストール中です。しばらく待ちます。
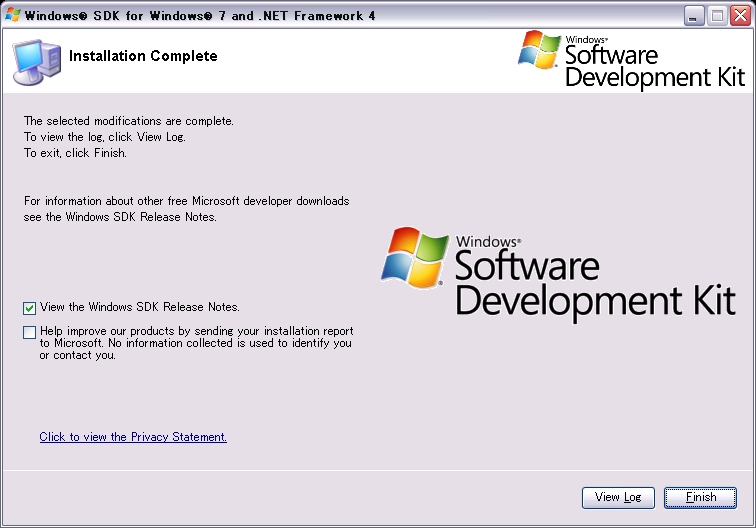
クリックで拡大 - 【Installation Complete】
インストールが完了したら「Finish」をクリックしてウィザードを終了します。
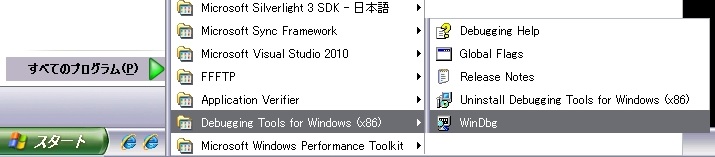
クリックで拡大 - スタートメニューの[すべてのプログラム]-[Debugging Tools for Windows(x86)]-[WinDbg]を起動します。
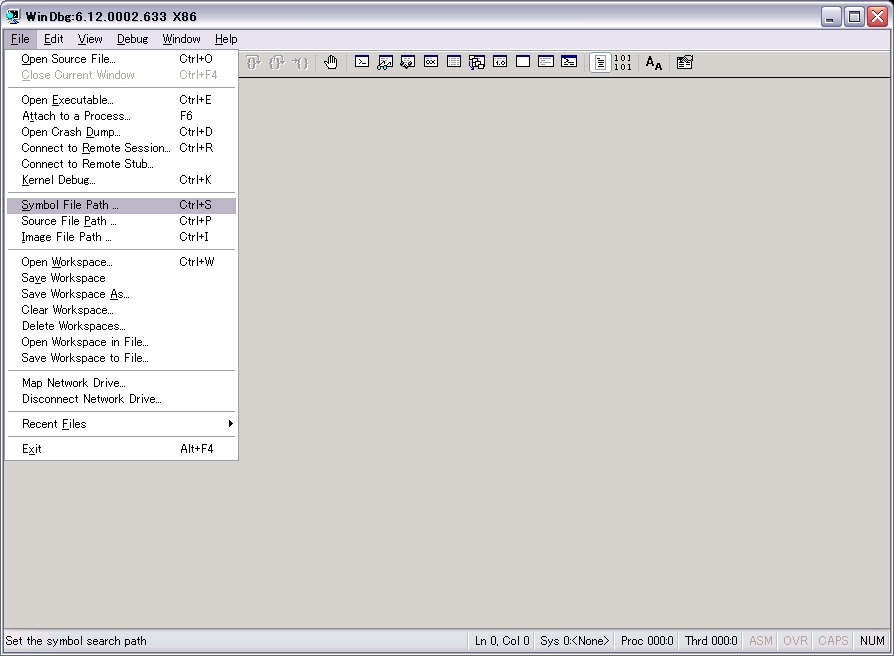
クリックで拡大 - WinDbgを起動したらシンボルファイルのパスを指定します。
[File]メニューから[Symbol File Path ...]をクリックします。
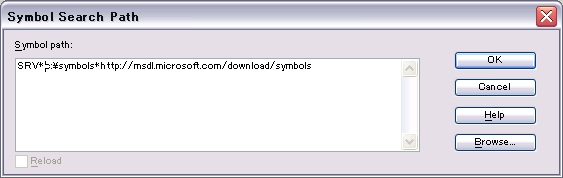
クリックで拡大 - 「Symbol Path」欄に以下のように入力します。
SRV*c:\symbols*http://msdl.microsoft.com/download/symbols
※赤字の部分はローカルのどこに保存するかを指します。環境に合わせて変更してください。
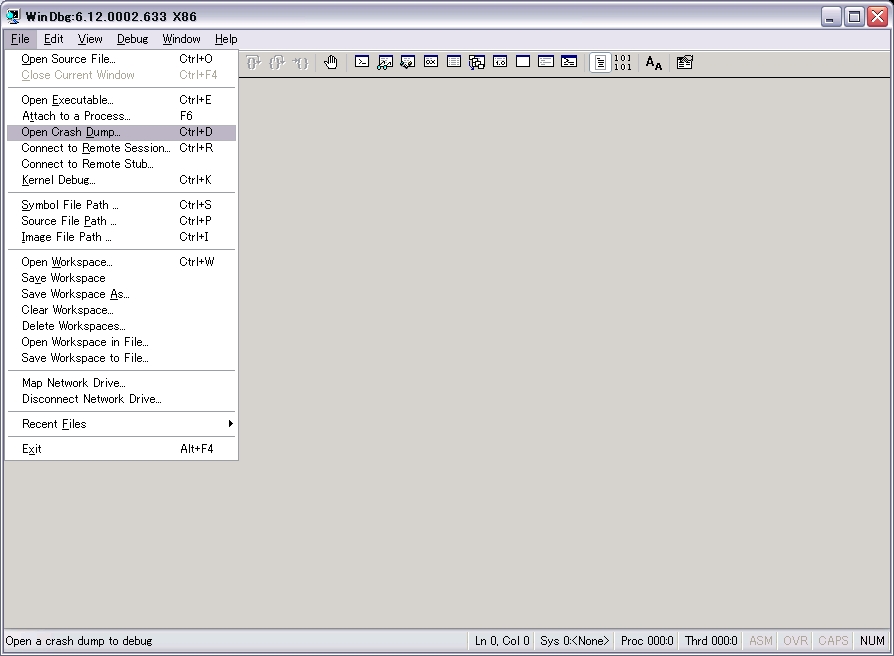
クリックで拡大 - ダンプファイルを開きます。
[File]メニューから[Open Crash Dump ...]をクリックします。
「ファイルを開く」ダイアログが起動しますのでメモリダンプファイルを選択します。
クリックで拡大 - ダンプファイルを開くと以下のような内容が表示されます。
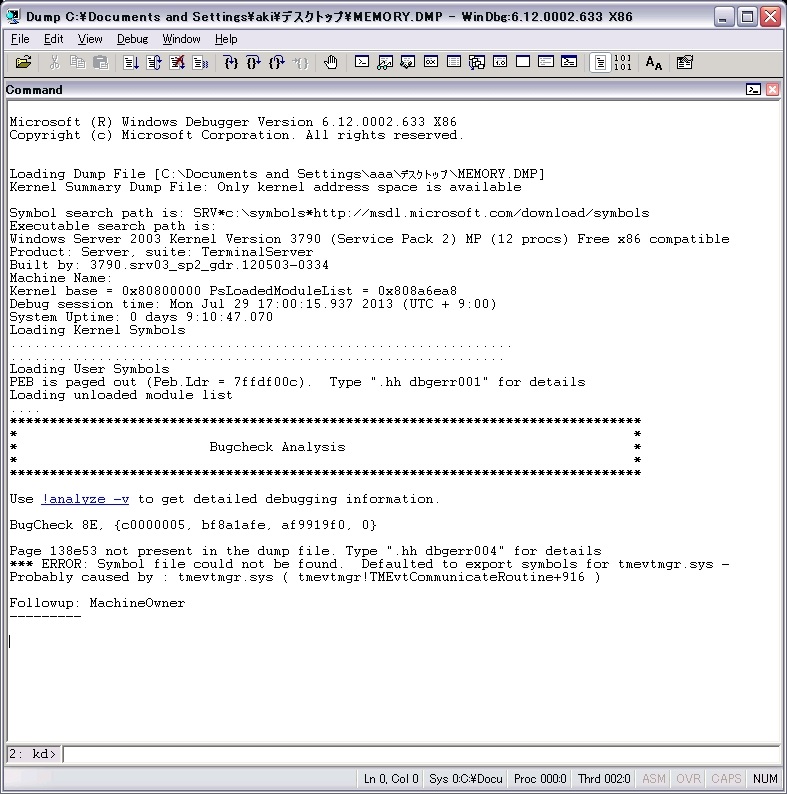
クリックで拡大Microsoft (R) Windows Debugger Version 6.12.0002.633 X86
Copyright (c) Microsoft Corporation. All rights reserved.
Loading Dump File [C:\Documents and Settings\aaa\デスクトップ\MEMORY.DMP]
↑開いたダンプファイルのフルパスが表示されます。
Kernel Summary Dump File: Only kernel address space is available
Symbol search path is: SRV*c:\symbols*http://msdl.microsoft.com/download/symbols
↑シンボルファイルの情報が表示されます。
Executable search path is:
Windows Server 2003 Kernel Version 3790 (Service Pack 2) MP (12 procs) Free x86 compatible
↑ダンプを出力したOSのバージョンが表示されます。
Product: Server, suite: TerminalServer
Built by: 3790.srv03_sp2_gdr.120503-0334
Machine Name:
Kernel base = 0x80800000 PsLoadedModuleList = 0x808a6ea8
Debug session time: Mon Jul 29 17:00:15.937 2013 (UTC + 9:00)
↑エラーが発生した日時が表示されます。
System Uptime: 0 days 9:10:47.070
↑OSが起動してエラーが発生するまでの稼働時間が表示されます。
Loading Kernel Symbols
...............................................................
..............................................................
Loading User Symbols
PEB is paged out (Peb.Ldr = 7ffdf00c). Type ".hh dbgerr001" for details
Loading unloaded module list
....
*******************************************************************************
* *
* Bugcheck Analysis *
* *
*******************************************************************************
Use !analyze -v to get detailed debugging information.
↑「!analyze -v」をクリックするとOSの自動解析が開始します。
BugCheck 8E, {c0000005, bf8a1afe, af9919f0, 0}
↑STOPエラーコードが表示されます。
Page 138e53 not present in the dump file. Type ".hh dbgerr004" for details
*** ERROR: Symbol file could not be found. Defaulted to export symbols for tmevtmgr.sys -
Probably caused by : tmevtmgr.sys ( tmevtmgr!TMEvtCommunicateRoutine+916 )
↑問題の原因と思われるファイルが表示されます。
Followup: MachineOwner
---------
- 「!analyze -v」をクリックしてOSの自動解析を実行します。
詳細情報がダンプされたら内容を確認し、原因と思われる箇所を特定します。
2: kd> !analyze -v
*******************************************************************************
* *
* Bugcheck Analysis *
* *
*******************************************************************************
KERNEL_MODE_EXCEPTION_NOT_HANDLED (8e)
This is a very common bugcheck. Usually the exception address pinpoints
the driver/function that caused the problem. Always note this address
as well as the link date of the driver/image that contains this address.
Some common problems are exception code 0x80000003. This means a hard
coded breakpoint or assertion was hit, but this system was booted
/NODEBUG. This is not supposed to happen as developers should never have
hardcoded breakpoints in retail code, but ...
If this happens, make sure a debugger gets connected, and the
system is booted /DEBUG. This will let us see why this breakpoint is
happening.
Arguments:
Arg1: c0000005, The exception code that was not handled
Arg2: bf8a1afe, The address that the exception occurred at
Arg3: af9919f0, Trap Frame
Arg4: 00000000
Debugging Details:
------------------
EXCEPTION_CODE: (NTSTATUS) 0xc0000005 - "0x%08lx"
FAULTING_IP:
win32k!xxxRedrawWindow+4c
bf8a1afe f6461e40 test byte ptr [esi+1Eh],40h
TRAP_FRAME: af9919f0 -- (.trap 0xffffffffaf9919f0)
ErrCode = 00000000
eax=00000001 ebx=00000000 ecx=0000029d edx=00000001 esi=00000000 edi=bd5c1858
eip=bf8a1afe esp=af991a64 ebp=af991a7c iopl=0 nv up ei ng nz na po nc
cs=0008 ss=0010 ds=0023 es=0023 fs=0030 gs=0000 efl=00010282
win32k!xxxRedrawWindow+0x4c:
bf8a1afe f6461e40 test byte ptr [esi+1Eh],40h ds:0023:0000001e=??
Resetting default scope
DEFAULT_BUCKET_ID: DRIVER_FAULT
BUGCHECK_STR: 0x8E
PROCESS_NAME: csrss.exe
CURRENT_IRQL: 0
LAST_CONTROL_TRANSFER: from 8082d828 to 80827c73
STACK_TEXT:
af9915bc 8082d828 0000008e c0000005 bf8a1afe nt!KeBugCheckEx+0x1b
af991980 8088a2da af99199c 00000000 af9919f0 nt!KiDispatchException+0x3a2
af9919e8 8088a28e af991a7c bf8a1afe badb0d00 nt!CommonDispatchException+0x4a
af9919fc bf85cc58 00000000 00000000 bd5c1818 nt!KiExceptionExit+0x186
af991a7c bf849c01 00000000 bd5c1858 00000000 win32k!xxxEndDeferWindowPosEx+0x29d
af991ad8 bf83bfdd 00000000 af991b40 bf8b75ef win32k!xxxDestroyWindow+0x21e
af991ae4 bf8b75ef be1145a8 bc9625f0 bc962570 win32k!HMDestroyUnlockedObject+0x1c
af991af8 bf8b79eb 8735b0d8 00000000 00000000 win32k!DestroyThreadsObjects+0x72
af991b40 bf8b6250 00000001 af991b68 bf8b70a2 win32k!xxxDestroyThreadInfo+0x23e
af991b4c bf8b70a2 8735b0d8 00000001 00000000 win32k!UserThreadCallout+0x4b
af991b68 8094bc40 8735b0d8 00000001 8735b0d8 win32k!W32pThreadCallout+0x3a
af991bf4 8094bfd3 00000000 00000000 8735b0d8 nt!PspExitThread+0x3b2
af991c0c 8094c325 8735b0d8 00000000 00000001 nt!PspTerminateThreadByPointer+0x4b
af991c30 f43d931e fffffffe 00000000 8a5130bc nt!NtTerminateThread+0x71
WARNING: Stack unwind information not available. Following frames may be wrong.
af991c50 f43d9eec 00000002 af991d48 8094c2b4 tmevtmgr!TMEvtCommunicateRoutine+0x916
af991d2c f43d68d4 af991d48 af991d50 f43d693d tmevtmgr!TMEvtCommunicateRoutine+0x14e4
af991d38 f43d693d 8a5130bc af991d48 fffffffe tmevtmgr+0x48d4
af991d50 808897fc 8a5130bc fffffffe 00000000 tmevtmgr+0x493d
af991d50 7c97845c 8a5130bc fffffffe 00000000 nt!KiFastCallEntry+0xfc
034effdc 00000000 00000000 00000000 00000000 0x7c97845c
STACK_COMMAND: kb
FOLLOWUP_IP:
tmevtmgr!TMEvtCommunicateRoutine+916
f43d931e 5e pop esi
SYMBOL_STACK_INDEX: e
SYMBOL_NAME: tmevtmgr!TMEvtCommunicateRoutine+916
FOLLOWUP_NAME: MachineOwner
MODULE_NAME: tmevtmgr
IMAGE_NAME: tmevtmgr.sys
↑問題が発生したファイル「tmevtmgr.sys」をクリックするとその詳細が表示される
DEBUG_FLR_IMAGE_TIMESTAMP: 4e030868
FAILURE_BUCKET_ID: 0x8E_tmevtmgr!TMEvtCommunicateRoutine+916
BUCKET_ID: 0x8E_tmevtmgr!TMEvtCommunicateRoutine+916
Followup: MachineOwner
---------
- 「discache」をクリックして表示された詳細情報
2: kd> lmvm tmevtmgr
start end module name
f43d2000 f43e4000 tmevtmgr (export symbols) tmevtmgr.sys
Loaded symbol image file: tmevtmgr.sys
Image path: \SystemRoot\system32\DRIVERS\tmevtmgr.sys
↑問題が発生したファイル「tmevtmgr.sys」のパスが表示されています
Image name: tmevtmgr.sys
Timestamp: Thu Jun 23 18:33:28 2011 (4E030868)
CheckSum: 000195FB
ImageSize: 00012000
Translations: 0000.04b0 0000.04e4 0409.04b0 0409.04e4
WinDbgを起動してシンボルファイルのパスを毎回設定するのが面倒な場合は環境変数に登録することもできます。
この手順はWindows のクラッシュダンプを解析する(Windows SDK for Windows 8)の手順と同じです。
【参考情報】
ブルー スクリーンの問題: クラッシュ ダンプや Web から手掛かりを見つける
STOPエラーコードの一覧
クラッシュダンプ解析のはじめの一歩
Ask CORE メモリダンプを解析する